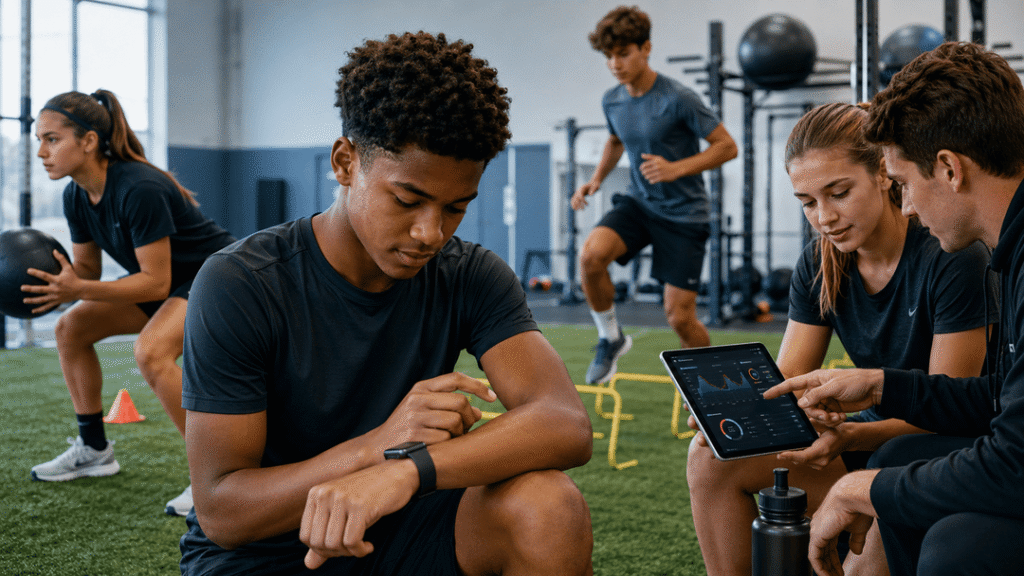
Remember the coach with a stopwatch and a squint? That era feels like ancient history. We’ve traded gut feelings for gigabytes, entering a world where your sweat is quantified and your heartbeat is a live data stream.
This is the 24/7 data revolution. It’s moved far beyond counting steps. Devices like the Fitbit, Garmin, and Whoop band promise a full-scale physiological audit, strapped to your wrist or tucked under your gear.
They monitor everything from movement to sleep, creating a constant buzz around recovery metrics and readiness scores. For today’s athlete, a coach’s eye is now supplemented by a dashboard.
But let’s be honest. Is this a genuine leap forward for human performance, or just a brilliantly marketed hype-machine? We’re here to strip away the glitter and examine the hardware. It’s time to look past the claims and see what this data actually delivers in the grueling, unpredictable theater of competition.
Heart Rate and Cardiovascular Monitoring
Your heart rate is like the main actor in sports. But the technology used to track it is like an understudy. It tells us about effort, strain, and how well your heart is doing. But the tech used to capture this story is key to getting real data.
Today, athletes face a choice between old and new tech. Chest straps use electrocardiography to track heart activity directly. It’s like a high-fidelity microphone right on the source. On the other hand, optical sensors shine light through your skin to read blood changes. It’s like having a constant observer.
But, optical sensors can struggle during intense moments. They might miss the peak in your heart rate. Chest straps, with their direct connection, stay accurate even when things get tough. This small difference can mean a lot for how well you recover and avoid injuries.
| Metric | Chest Strap Monitor | Optical Wrist Sensor |
|---|---|---|
| Core Technology | Electrocardiography (ECG) | Photoplethysmography (PPG) |
| Accuracy at High Intensity | High (direct electrical measurement) | Variable (prone to motion artifact) |
| Comfort & Convenience | Can feel restrictive, needs moisture | Sleek, always-on wearability |
| Primary Use Case | Training sessions, performance testing | All-day tracking, recovery insights |
Why is heart rate so important? It’s like a wire into your body’s energy use. By measuring heart rate, we can guess how much oxygen your body is using. This helps coaches understand how hard athletes are working without needing lab equipment.
We’re moving from just counting heartbeats to understanding the gaps between them. Heart rate variability (HRV) shows how well your body is handling stress. It’s like a daily mood check for your nervous system.
High HRV means you’re relaxed and ready for more. Low HRV signals stress or fatigue. For athletes, tracking HRV helps decide if they’re ready for more work or need a break.
This changes heart rate monitoring from just tracking effort to understanding recovery. It’s about more than just how hard you worked. It’s about how well you’re recovering. This shift helps athletes know when to push harder and when to take it easy.
GPS Tracking and Movement Analysis
Modern athletic tracking devices use satellites to track player movement with high accuracy. They turn the playing field into a live-action video game. Every athlete has their own dot, leaving a digital trail.
The tech is simple yet effective. A network of 31 satellites sends signals to athletes. Ground stations correct the data, making positions accurate to within one meter. It’s not for finding your way home but for mapping the brutal geography of a match.
![]()
In sports like rugby and soccer, this data is invaluable. Coaches can see how far players run and how fast they go. It shows movement patterns, helping coaches design better drills.
Devices like the Garmin Vivofit and Fitbit Surge made this tech available to everyone. Now, weekend warriors can track their runs and bike rides with professional metrics. But, team systems like Catapult and GPSports are the heavy artillery for professional teams worldwide.
But, there are limits. GPS works well on open fields but struggles in tight spaces like basketball courts. For these sports, other sensors like accelerometers and gyroscopes are needed.
| Device Category | Primary Sports | Key Metrics Tracked | Accuracy Level | Best Use Case |
|---|---|---|---|---|
| Consumer GPS Watches | Running, Cycling, Hiking | Distance, Pace, Route, Elevation | Moderate (3-5 meter variance) | Individual fitness tracking & training |
| Professional Outdoor Systems | Soccer, Rugby, AFL, Football | Player Load, Sprint Distance, High-Speed Running, Metabolic Power | High (Sub-1 meter variance) | Team performance & injury prevention |
| Court Sport Sensors | Basketball, Tennis, Volleyball | Jumps, Changes of Direction, Impacts, Acceleration | Movement Quality (not position) | Explosive power & technique analysis |
| Hybrid Multi-Sport Devices | Triathlon, Adventure Racing | Multi-sport Transition, Swimming Stroke, Cycling Power | Variable by activity | Endurance event preparation |
So, what’s the verdict on GPS as an athletic tracking device? It’s a game-changer for understanding the cost of sport. It answers questions we couldn’t ask before, like how much a player runs and when they get tired.
But, it’s not the only tool. The smart coach knows GPS data is just one piece of the puzzle. It shows where someone went and how fast, but not how hard they worked or how efficiently they moved. The future is a suite of devices working together, each telling part of the athlete’s story.
Sleep and Recovery Optimization
That glowing ‘87% Readiness’ score on your wrist is more marketing than science. Wearable brands promise to turn last night’s sleep into a single number. It’s tempting, but it’s too simple.
These algorithms use your heart rate, sleep, and more to give a score. But they don’t share how they weigh each factor. You’re trusting a secret without knowing the recipe.
A low score can make you doubt yourself before you even start. It causes data anxiety. An athlete might feel heavier or less focused because of it.
Think of your wearable’s recovery data as smoke. It shows something might be off, but you need to find out why. A bad sleep score is a chance to talk, not a reason to skip training.
A college swimmer had low recovery scores. The coach wanted to reduce training. But the athlete was stretching for 90 minutes each night, thinking it helped. Her wearable didn’t see the good in her efforts.
Good sleep and recovery optimization mixes facts with feelings. The sleep data shows what happened. The athlete’s thoughts explain why.
This balanced approach is backed by sleep science research. It highlights the importance of individual sleep needs. Your device’s numbers should start a conversation, not end it.
So, what’s the plan? Don’t make the readiness score the only thing you look at. Use it as one piece of information. Add your own thoughts on how you feel and how sore you are.
Teach your athletes about what the metrics really mean. Explain that heart rate variability shows balance, not just recovery. Tell them one bad night isn’t a disaster—it’s the pattern that counts.
Optimization is about building strength, not getting a perfect score. It’s about knowing when to trust your feelings, even if your device doesn’t agree. Wearables offer insights, but it’s up to us to use them wisely.
Biomechanical Analysis Through Wearables
Imagine your wristband critiquing your golf swing or spotting the flaw in your swim stroke. Welcome to biomechanical analysis, where wearables go beyond tracking where you moved. They now reveal how you moved. This is a big leap from the simple pedometers of the past.
At the core of this change are tiny sensors called accelerometers and gyroscopes. They’re so small, they fit on a chip the size of a fingernail. These sensors capture every movement your body makes. Unlike old pedometers, they tell the full story of your movements.
The old pedometer was like a metronome for your hip. It counted steps but didn’t understand quality or power. Today’s biomechanical wearables are like advanced tools. They turn athletic movement into data, showing forces, angles, and more.
In swimming, these sensors can break down stroke mechanics with great detail. They spot energy-wasting moves and show what makes a swim efficient. For golfers and tennis players, swing analysis is now at your wrist.
These devices measure club head speed and swing plane. They even detect tiny tremors that show inconsistent contact. You get detailed data, like from a $10,000 launch monitor.
Team sports use time-motion analysis through wearables. In Australian football, sensors track movement intensity and type. Rowers analyze stroke symmetry and power. This data shows who’s working smart, not just hard.
One key output is energy expenditure estimation. These devices calculate calories burned with better accuracy than heart rate. They show that efficient runners burn less energy than those with poor technique. This is vital for endurance athletes.
This shift is huge. You don’t need a fancy lab to analyze your movements. Wearables make biomechanics accessible. This has led to “the quantified athlete,” who knows their movement as well as their heart rate zones.
For injury prevention, this is a game-changer. Sensors can spot mechanical flaws before they cause injuries. They alert you to issues like uneven leg use or shoulder rotation problems. This early warning system can prevent many injuries.
Improving performance is also precise. By cutting out wasteful movements, you save energy for important moments. Optimizing technique means more power with less effort. Wearables offer constant feedback, making every practice a chance to improve.
There’s a learning curve, though. Raw data looks complex. But with the right algorithms, it reveals insights about your movement quality. Once you understand this, you can correct what was invisible before.
The pedometer just told you you moved. Modern biomechanical analysis shows how well you moved. This difference is key in the quest for athletic excellence.
Team-Based Monitoring Systems
Forget the lone runner with their smartwatch. Modern team sports are like a tech startup’s command center. It’s not just about individual metrics; it’s about understanding the whole team. This is where team-based monitoring systems come in, turning athletes into a living data set.
It’s like moving from a personal diary to a live broadcast of a city. Systems like Catapult and Zephyr give a god’s-eye view. A Catapult pod, small as a matchbox, sits on a player’s back. It tracks more than location, spewing out data on explosive movements, distance, and heart rate.
The Zephyr BioHarness or BioPatch takes a closer look. It’s a chest strap or patch that monitors the heart and breath. Together, these systems show not just what an athlete did, but the cost of doing it.
Coaches love the promise of these systems. They see the whole game, not just the players. They can spot who’s working hard and who’s coasting. This helps manage workloads and predict injuries.
But there’s a practical side. Getting ready for a game isn’t just about tape and stretches. It’s about putting on sensors and shoulder pads. It’s about making sure expensive tech survives the game and the athlete’s patience.
So, what do these systems offer? The table below shows how they turn a team into data.
| System | Primary Form Factor | Core Data Streams | Team Management Insight | The Practical Hurdle |
|---|---|---|---|---|
| Catapult | Pod worn between shoulder blades | High-fidelity GPS, Accelerometry, Inertial Movement | Player load, movement efficiency, sprint efforts, overall work rate | Fitting under protective gear; ensuring consistent pod placement for data accuracy |
| Zephyr BioHarness | Chest strap or adhesive BioPatch | ECG (Heart Rate Variability), Respiratory Rate, Core Temperature | Physiological stress, recovery status, exertion level, autonomic nervous system response | Skin irritation, maintaining electrode contact during intense sweat, comfort during play |
| Combined Power | Both systems used in tandem | Movement + Physiology = Total Athlete Load | Identifies athletes at high injury risk (high load + poor recovery), optimizes sub rotations, tailors training | Doubled equipment, data synchronization, increased athlete “gear burden” |
The real power is in the patterns. Coaches can see if new drills cause fatigue. They can spot players whose performance drops in the fourth quarter. This is sports science in action.
Data needs interpretation. A lot of GPS and heart rate figures can be overwhelming. But that’s a good problem to have. It’s better than flying blind.
In the end, these systems answer a simple question: Who is working, and who is just dressed for work? The data doesn’t lie. Athletes in the modern era are gearing up for total transparency.
Data Privacy and Security Issues
Privacy policies in wearable tech are like the fine print on a Faustian bargain. We agree quickly, giving up our personal data for better performance. But, who owns our heart rate data?
That sleek device on an athlete’s wrist does more than count steps. It collects personal data, creating a digital twin with its own privacy rights.

Accessing your own data is a red flag. True collaboration means you get full access to your data. You should be able to use, change, and own your body’s data. If a company goes bankrupt or changes its algorithm, your data shouldn’t be lost.
Think about it. Your training history is locked in a proprietary app. It’s like owning a house with someone else holding the key. That generic privacy policy is more important than the device’s battery life. Your sensitive information—like heart rate and sleep patterns—deserves better than being used for research without your consent.
Let’s break down what you’re agreeing to when you click “I Accept”:
- Data Ownership: Are you licensing your biometrics or giving them up?
- Third-Party Sharing: Where does your sweat data go after it leaves your skin?
- Security Protocols: How is your sensitive information protected from hackers?
- Long-Term Access: Can you download your training data in a usable format?
The sports tech industry operates in a gray zone. Health data gets HIPAA protection, but athletic performance data doesn’t. Your resting heart rate has fewer legal safeguards than your medical chart, despite telling the same story about your body.
We’re creating detailed human performance databases, but ethics are lagging. In the race for better performance, we can’t ignore data security. Athletes deserve to know where their data goes, who profits from it, and how it’s protected.
Ask tough questions before using the next wearable tracker. Demand data formats you can use. Read privacy policies carefully. Your biometric story should belong to you, not be someone else’s property.
Interpreting Wearable Data Effectively
Your locker room is like a tech lab, and your dashboard is full of graphs. You’ve collected a lot of data. Now, you need to find the important information.
Think of yourself as a performance translator. Your job is to find the useful data. I use a simple rule called the “Interesting–Useful Matrix.” Every data point falls into one of four areas.
The goal is to focus on the “Useful” data. Knowing an athlete’s skin temperature at 3 AM is interesting but not useful. But noticing a 15% drop in heart rate variability when training increases is very useful.
The wearable industry wants you to focus on the interesting data. But your job is to ask if this data can help change behavior or prevent injuries.
Here’s a breakdown of how to categorize the flood of information. This table helps you deal with data overload.
| Data Type | Interesting (But Often Useless) | Useful (The Actionable Gold) | Primary Question to Ask |
|---|---|---|---|
| Recovery Metric | Exact sleep stage duration (REM vs. Deep). | Consistent trend in Sleep Score or HRV relative to training strain. | Does this trend correlate with their perceived fatigue or next-day performance? |
| Movement Data | Total left vs. right leg swing symmetry during a walk. | Sudden change in ground contact time or vertical oscillation during runs. | Does this change indicate emerging fatigue or a technical flaw? |
| Workload Metric | Peak heart rate for a single, random drill. | Weekly Acute:Chronic Workload Ratio (ACWR). | Is the athlete in the optimal “sweet spot” or heading into injury risk? |
| Readiness Score | Taking the daily score as an absolute, magical truth. | Using the score as a conversation starter with the athlete about *how* they feel. | Is the device’s algorithm confirming or contradicting the athlete’s subjective input? |
See the difference? One side is trivia, the other is a compass. Remember, just because you can measure something, doesn’t mean you should. Use your time and brainpower wisely.
Don’t just look at the dashboard. The best insights come from combining device data with human context. A dip in HRV is more meaningful when the athlete mentions stress. A spike in training load is concerning unless they’ve handled it before.
Effective interpretation turns numbers into a story. It’s about strain, adaptation, fatigue, and readiness. Your performance monitoring tech gives you the words. You need to tell the story. Stop getting lost in data. Find the right information.
Integration with Coaching Programs
So, you’ve got all this data from wearables. Now, what’s next? The real challenge starts when numbers meet coaching smarts. It’s like having a GPS for athletic ability—you need someone to know how to use it.
A study of 130 coaches in 14 countries found most use heart rate and GPS daily. But the real magic happens when these numbers guide training. If 88% of trainers track heart rates, shouldn’t that shape conditioning plans?
The study shows coaches want tech that’s useful. They won’t use it if it feels like homework. But when an Oura ring’s sleep data shows why an athlete did poorly, that’s gold. Coaches want to see results to keep using wearables.
True integration means using all this data. GPS shows a winger fades late? Adjust their stamina work. Accelerometer reveals uneven loading? Time for targeted strength training. This isn’t about making athletes robots. It’s about smarter coaching with evidence, as sports science research shows.
The future isn’t just more data. It’s coaches who can turn biometrics into better performances. When wearables and wisdom team up, athletes really step up their game.